
How does this table work?
Getting the big picture is not easy
Understanding how a table works or how the fields of a table hang together can sometimes be a daunting task, and a real grind, particularly if
- the table is complex / there are many or deeply nested field calculations
- you are new to the table or returning to a table after a long time
- the purpose of a table is unclear
- the field naming conventions are different to your daily style
- there is no documentation (which, of course, I am assuming is the case)
The Problem
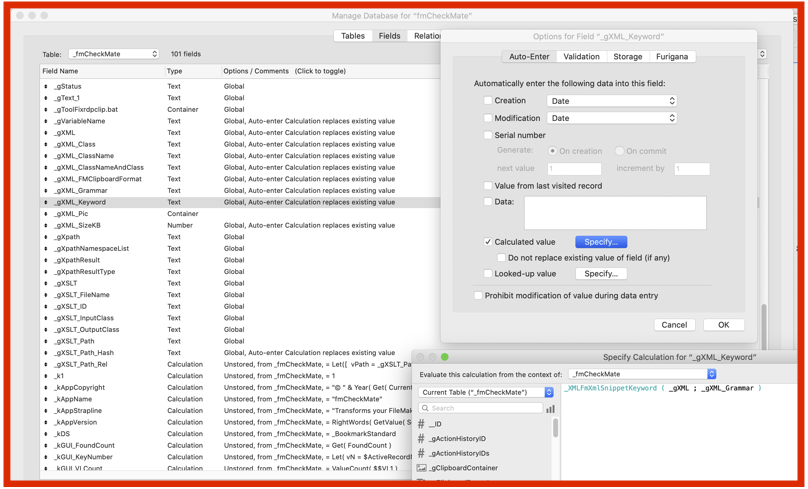
Clicking through a table’s field definitions in FileMaker is not a particularly efficient way to get an overview of how a table works. Calculations can be complex, long, or deep, and you may have to open and close many field calculation definitions and take notes to piece together how the fields hang together to make the table work.
Moreover, when Auto Enter calculations are used, it makes it even harder:
- you have to make double the amount of clicks,
- they obscure which fields are input fields and which are output fields!
All in all It’s hard to get the big picture, and it can take a lot of time to get a good overview of how a table works!
Fed up of trawling though field definitions to understand how fields hang together?
MrWatson’s Solution
With fmGraphIt you can just copy the fields and with a few clicks get the big picture!
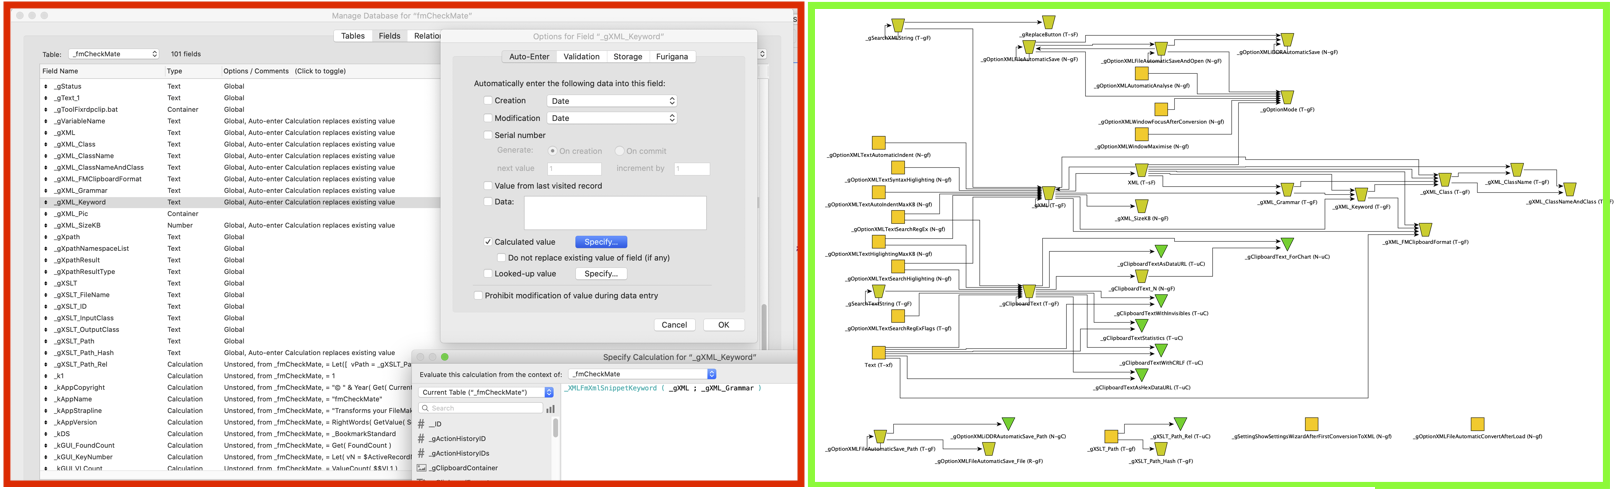
- A picture is worth a thousand words!
- A detailed network with tooltip calculations is worth far more than a thousand words!